
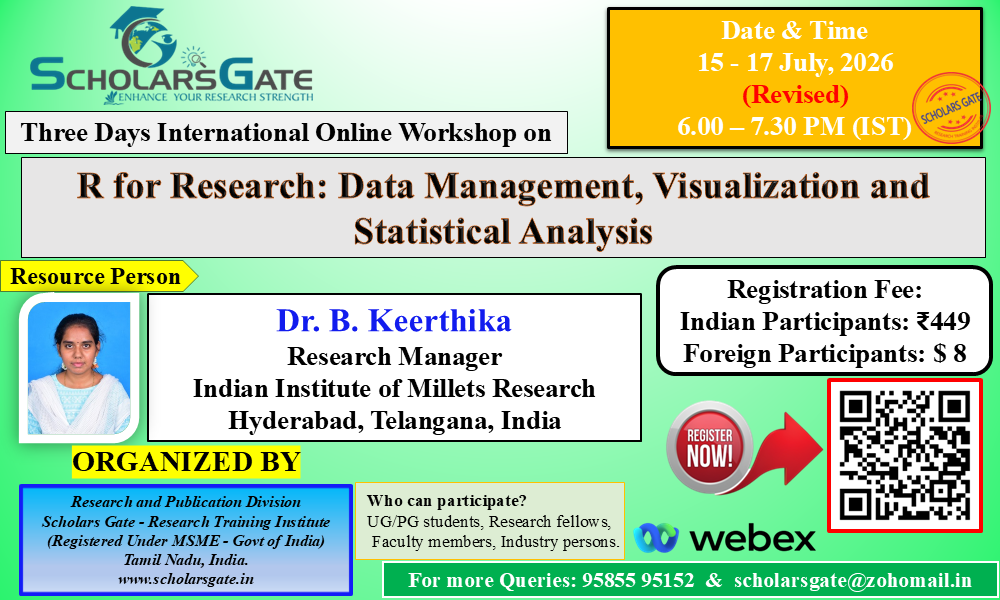
R for Research: Data Management, Visualization and Statistical Analysis
Topics Covered
Day 1: Introduction to R and Data Management
- Introduction to R and RStudio environment
- Installation of packages and setting working directory
- Understanding data types and data structures (vectors, matrices, data frames)
- Importing data from Excel and CSV files
- Data cleaning and preprocessing
- Handling missing values and data transformation
Day 2 : Data Visualization and Exploratory Data Analysis
- Introduction to Exploratory Data Analysis (EDA)
- Data visualization using ggplot2
- Creating histograms and boxplots
- Bar charts and pie charts for categorical data
- Scatter plots and trend lines
- Line graphs for trend analysis
- Customizing and exporting publication-quality figures
Day 3 : Statistical Analysis for Research
- Introduction to statistical inference in R
- Correlation analysis and correlation matrix
- Hypothesis testing: t-test and ANOVA
- Simple and multiple linear regression analysis
- Interpretation of regression outputs and model diagnostics
- Exporting statistical results for reports and publications
Registration Fee
Indian Participants: ₹ 449
Foreign Participants: $ 8
Note: ✅Participants will receive the meeting details 24 hours before the event
✅ Participants will receive electronic certificates and video recording links after completion of the workshop.